Upgrading From 22x22x1 MERV 8 to MERV 13—Is It Worth It?

Photo-realistic comparison of two HVAC air filters in a modern home, highlighting a 22x22x1 MERV 8 air filter next to an upgraded MERV 13 filter, alongside a clean vertical infographic illustrating improved air quality, health benefits, energy efficiency, and HVAC protection.

In a pre-2010 HVAC system with a fixed-speed blower motor, a 22x22x1 MERV 13 filter can behave like one that’s already half-clogged—from the moment you install it. The system runs longer to reach temperature, the energy bill climbs, and the air quality improvement—while real—costs more to deliver than most homeowners expect. Here’s what most filter … Read more

Wichita, Kansas Live Air Quality Index AQI Map Now & Today

An image providing real-time Air Quality Index (AQI) data across Wichita, Kansas, using color-coded overlays and detailed numerical readings to indicate precise pollution levels. Users benefit by monitoring current conditions and predicting short-term trends, empowering them to make informed decisions for their health and outdoor activities.

Wichita’s air doesn’t warn you. On a hot June afternoon, ground-level ozone can push the Air Quality Index (AQI) well into the orange range while the sky looks clear and the weather app shows nothing unusual. Agricultural dust from surrounding farmland, emissions from Sedgwick County’s industrial operations, and seasonal ozone formation all contribute to readings … Read more

Why Carbon Monoxide Poisoning Spikes Every Winter

A purple-themed infographic explaining why carbon monoxide poisoning spikes in winter through four key factors: constant home heating, tightly sealed houses, malfunctioning appliances, and the improper indoor use of portable devices.

During Nashville’s January 2026 ice storm, more than 20 people showed up at emergency rooms with carbon monoxide poisoning in a single 24-hour stretch. Most of them had done exactly what you’d expect when the power went out: fired up a generator, closed the doors against the cold, and waited for the heat to kick … Read more

Cleaning vs Replacing 21.5x24x1 MERV 13 Filters

Side-by-side visual comparison of Cleaning vs Replacing 21.5x24x1 MERV 13 filters, showing a person brushing a dirty filter with cleaning supplies on the left, and a person installing a brand new filter into an HVAC unit on the right.

Pull a gray 21.5x24x1 filter from your return vent and the temptation makes sense. Rinse it off, let it dry, slide it back in, save the cost of a new one. We’ve run this test at FilterClarity.com more times than we’d like to count. The filter goes back in looking usable and immediately stops working … Read more

Stockton, California Live Air Quality Index (AQI) Map Now & Today

A photograph of the Stockton, California riverfront city skyline with a blurred background and a clean, digital data visualization map projected over the water, serving as a live air quality index AQI map for Stockton, California, showing current and daily readings. The semi-transparent map features the street grid labeled 'STOCKTON' and multiple colorful pin drops with numerical AQI values, like a center green '7', a right orange '12', a yellow '3', and glowing light blue data flow lines connecting across the city.

Pull up Stockton’s AQI on a July afternoon and you might see a number that changes your plans entirely. Wildfire smoke rolling in from the Sierra Nevada foothills can push that reading from Moderate to Unhealthy within a few hours, with almost no warning. San Joaquin County holds a federal nonattainment designation for both ozone … Read more

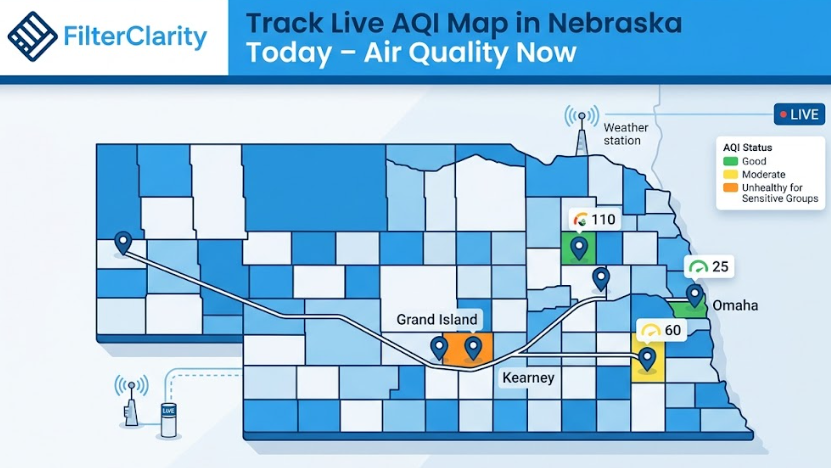
Track Live AQI Map in Nebraska Today

A clean, modern vector illustration for filterclarity.com titled 'TRACK LIVE AQI MAP IN NEBRASKA TODAY – AIR QUALITY NOW'. A color-coded Nebraska map shows live AQI data for specific locations: Grand Island (110 - Unhealthy for Sensitive Groups), Kearney (50 - Good), Lincoln (60 - Moderate), and Omaha (25 - Good). A detailed legend is included, and a large empty space is at the bottom.

Most Nebraskans check the weather before heading outside. Fewer check the AQI. That gap matters more than most people realize, especially from June through October, when wildfire smoke drifts east from the Rockies and agricultural burns push PM2.5 levels well above what a standard MERV 8 filter can handle. At FilterClarity.com, we track regional air … Read more

What Unexpected Factors Increase the Cost of Attic Insulation Removal?

An infographic breakdown of car air conditioning repair costs across six categories with practical tips for drivers to avoid overpaying for services.

A $3,000 attic insulation removal that balloons to $9,000 after the contractor finds mold, vermiculite, and buried junction boxes. We’ve heard that story from FilterClarity.com readers more times than we can count. The baseline estimate looked right at $1 to $2 per square foot. Then the actual attic told a different story. Most attic insulation … Read more

Tucson Arizona Live Air Quality Index AQI Map Now & Today

A 3D isometric illustration of a stylized Tucson, Arizona desert with mountains and Saguaro cacti, featuring a floating transparent digital city map. Colored nodes (Green, Yellow, Orange) are placed on the map grid to visualize the 'Tucson Arizona Live Air Quality Index AQI Map Now & Today'. A matching digital dashboard shows a circular AQI gauge and air current graphics.

Tucson’s Air Quality Index can go from “Good” to “Unhealthy” in under an hour. We track air quality data across the Southwest at FilterClarity.com, and no city in our coverage area shifts that fast when a haboob pushes through or wildfire smoke drifts down from the surrounding forests. Three seasonal forces drive Tucson’s AQI: monsoon … Read more

Track Live AQI Map in Jacksonville Florida Today – Air Quality Now

A transparent digital dashboard displaying a 'Live AQI Map' is overlaid on a photograph of the Jacksonville, Florida skyline. This visualization shows how to track live AQI data, representing the 'Air Quality Now' for the region.

Check your Jacksonville AQI right now and you’ll see a number that has a direct line to what you’re breathing inside your home — but almost nobody treats it that way. Most residents check the weather before heading out. Few check the air quality. We think that’s worth changing. The EPA has found that indoor … Read more

What Causes Excessive Lint Behind the Dryer?

This image details four primary factors that contribute to excessive lint building up behind your clothes dryer. The illustration identifies a clogged transition hose, improper vent installation, blocked outside vent hoods, and damaged dryer seals as the key causes.

Pull your dryer away from the wall and you will likely find more than just dust. At FilterClarity.com, we have investigated this exact problem across dozens of reader situations and found that excessive lint behind the dryer almost always traces back to one of a few fixable root causes most homeowners never consider. The lint … Read more